Available here.
All posts by David Doyle
4/08 graphics
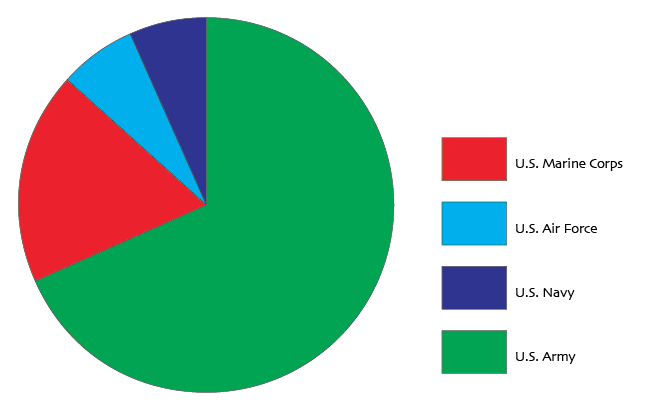
Breakdown of living Medal of Honor recipients by branch.
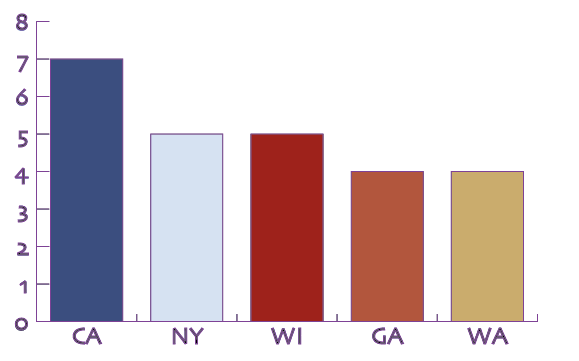
Medal of Honor recipient origin: Top 5 states
David Doyle and Sam Habib
Map Test 4/03
Map test 4/1/14
David Doyle and Sam Habib
2/19 assignment: February ACA numbers released
by David Doyle and Sam Habib
-
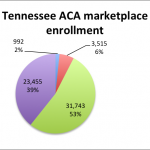
- A breakdown of Tennessee’s current cumulative ACA enrollment by month, October 2013 – January 2014
-
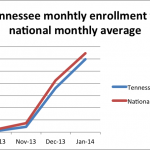
- A comparison of Tennessee’s marketplace enrollment figures vs. the national average, October 2013 – January 2014
-
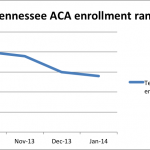
- Despite trending slightly lower than the national average, Tennessee has consistently been in the top 20 states in terms of enrollment figures since the ACA marketplace opened.
The latest federal government enrollment numbers for marketplace plans put into place by the Affordable Care Act are out, and for the fourth month in a row, Tennessee’s enrollment numbers place its rank in the upper half of participating states.
As they have since the marketplace’s October opening, Tennessee’s Affordable Care Act enrollment numbers lagged behind the total national average across all states and the District of Columbia. But at the same time, the number of new Tennessee residents enrolling in an ACA marketplace insurance plan was nonetheless enough to keep it ranked in the top 15 states in terms of marketplace enrollments for the second consecutive month.
As of February 1st, 59,705 Tennesseans enrolled in an ACA marketplace health insurance plan, nearly 5,000 short of the national average of 64,696. Though this number is below the national average, it is skewed by the enrollment rates of high population states like California, which added over 728,000 new enrollees by the end of January, and Florida, which added nearly another 300,000.
Recent data shows that enrollment in the combined 45-64 age group rose significantly more than any other age group by 53%, while enrollment in the 18-34 age group only saw a 25% overall rise. In Tennessee, however, enrollment dropped in the 55-64 age group by 2%, from 35% to 33%, with the rates of 18-25 year olds remaining the same.
Tennessee’s enrollment numbers as of February were enough to move Tennessee into the 14th rank overall in terms of number of new enrollees. Tennessee has consistently been in the upper half of states when ranked in terms of the number of new residents enrolling in an ACA-backed insurance plan, moving from the 20th spot as of the end of October to 15th by the end of 2013.
Tennessee’s January numbers show a relative slowdown in the number of new enrollees compared to December. After a rocky first two months left Tennessee with just over 4,500 enrollees as of the end of November 2013, Tennessee saw a sharp upswing in enrollees, adding 31,743 new participants to its marketplace rolls in December. January’s total of 23,455 represents a mild drop compared to December’s jump.
2/13 assignment (snow day edition)
Summer 2012 Olympics – medals won by team/country/event across multiple teams/countries
This graphic, which takes up multiple boxes across the bottom third of my storyboard, would allow users to view medal counts by the team selected in the upper 2/3 of the piece. Additional analytical functionality could be baked into the system by allowing semi-transparent graphical overlays to display multiple teams’/countries’ medal counts.
494 Assignment 1
Bachmann’s Retirement Reduces Electoral Risk for G.O.P.
Nate Silver, FiveThirtyEight
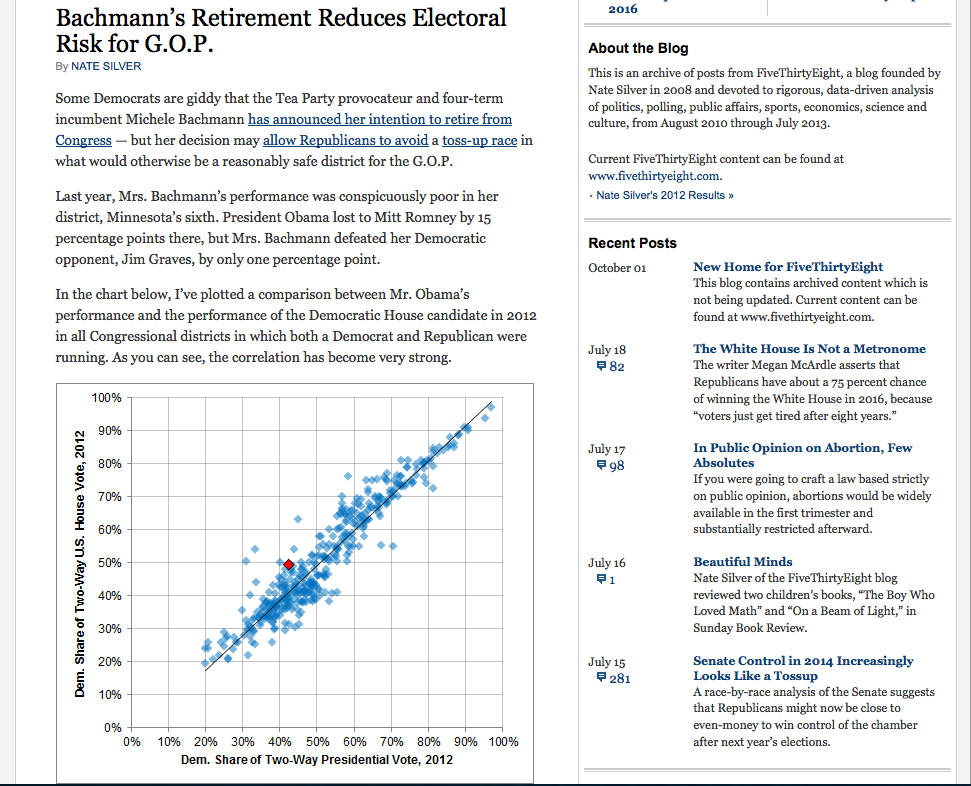
FiveThirtyEight is kind of easy mode for this kind of thing, but it’s nonetheless worthwhile to look at some of the less obvious things they do over there. Here, Silver uses a dataset to provide insight into a political matter that was heretofore the sole domain of the gut reaction. Losing a controversial representative like Bachmann just has to be good for the Democratic party, right? Well, not so much, if the data has anything to say about it.
A Tangled Web: Who’s Making Money From All This Campaign Spending?
ProPublica
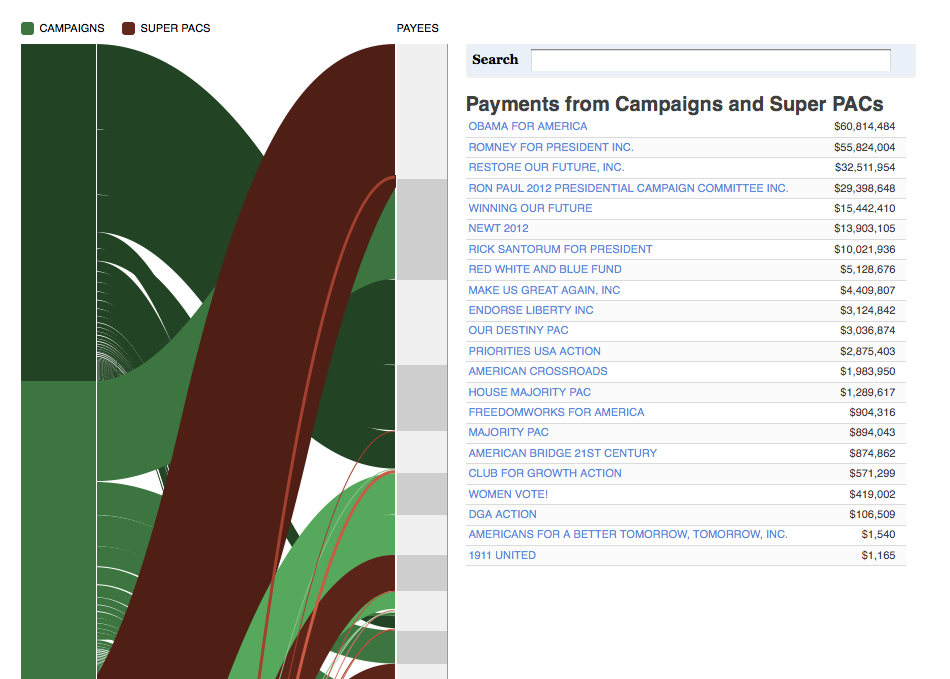
Here, ProPublica highlights the real winners of the 2012 presidential election – the 200 biggest recipients of campaign spending, each with their own tidy little summary and spaghetti-like series of links back to their respective political benefactors. Sifting through this visualization for any length of time shows the user that even the most complex sets of data can be distilled to the point where their intrinsic complexities fall away, leaving the user free to understand and react to the underlying points.
Gay rights in the US, state by state
US interactive team, the Guardian
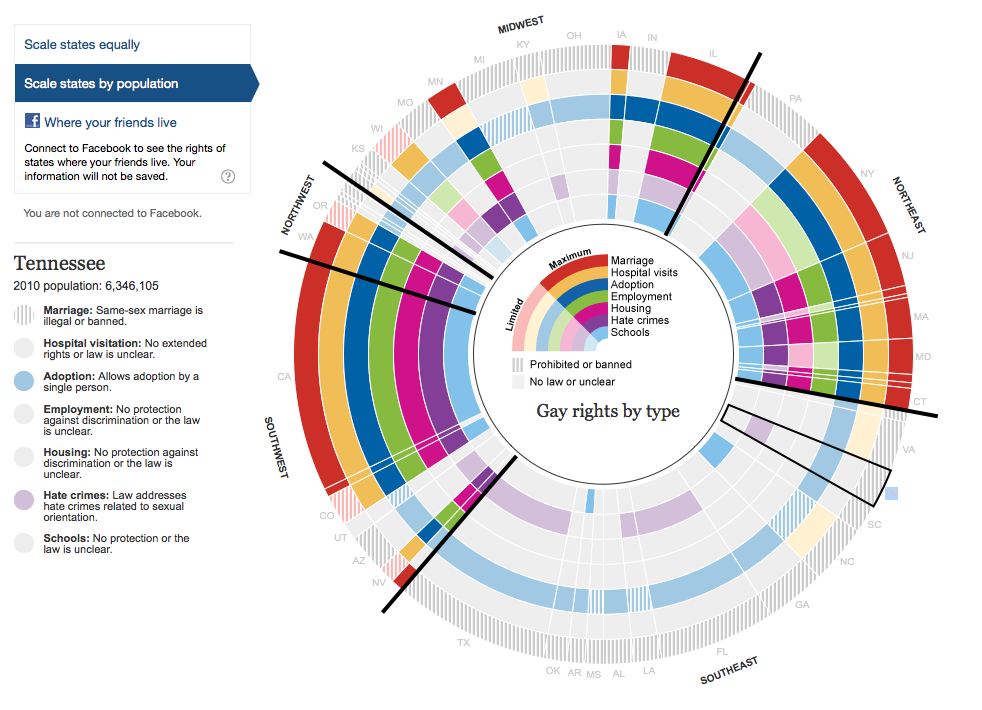
This is a relatively simple set of data: take fifty states, sort them by geographic location, add some population data, mark seven fields using one of four flags (allowed, limited, prohibited, or unclear), garnish with social media links and bake until done. What happens here is inflation by conflation – by building a vibrant visual composite out of a series of dry data points, the end user is given the tools by which he or she can gain a greater understanding of each division (by state, by region, by population, or by type of right) without needing to go to great calculatory lengths.