Bachmann’s Retirement Reduces Electoral Risk for G.O.P.
Nate Silver, FiveThirtyEight
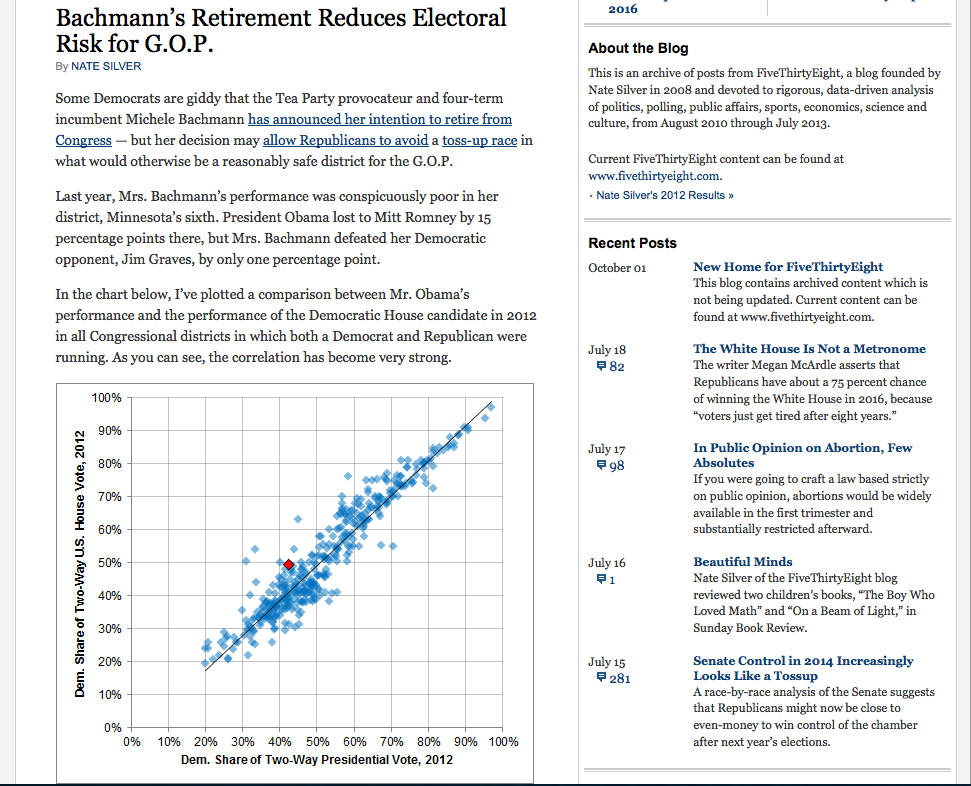
FiveThirtyEight is kind of easy mode for this kind of thing, but it’s nonetheless worthwhile to look at some of the less obvious things they do over there. Here, Silver uses a dataset to provide insight into a political matter that was heretofore the sole domain of the gut reaction. Losing a controversial representative like Bachmann just has to be good for the Democratic party, right? Well, not so much, if the data has anything to say about it.
A Tangled Web: Who’s Making Money From All This Campaign Spending?
ProPublica
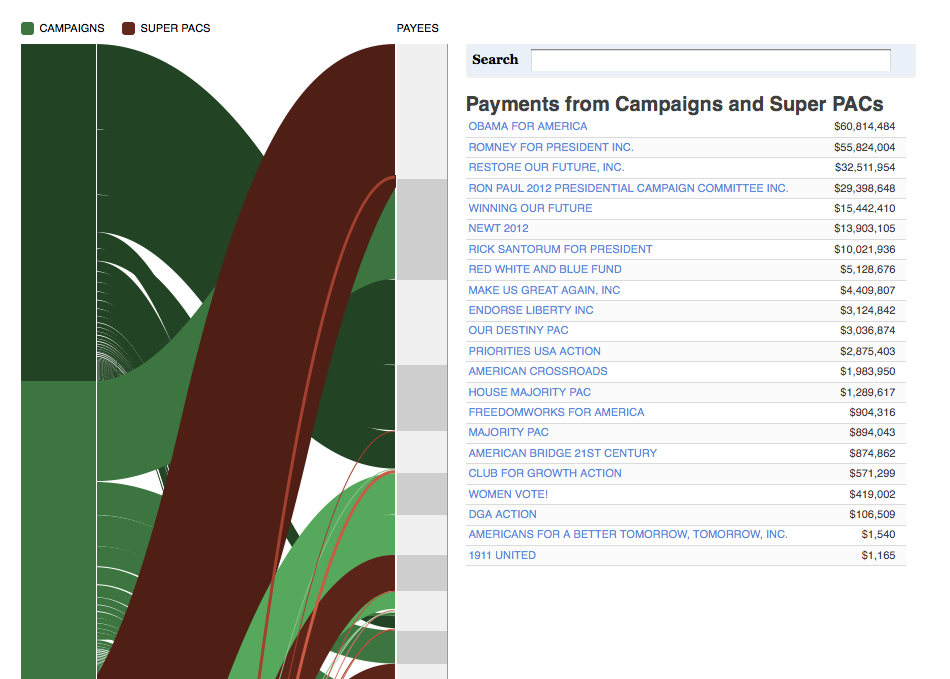
Here, ProPublica highlights the real winners of the 2012 presidential election – the 200 biggest recipients of campaign spending, each with their own tidy little summary and spaghetti-like series of links back to their respective political benefactors. Sifting through this visualization for any length of time shows the user that even the most complex sets of data can be distilled to the point where their intrinsic complexities fall away, leaving the user free to understand and react to the underlying points.
Gay rights in the US, state by state
US interactive team, the Guardian
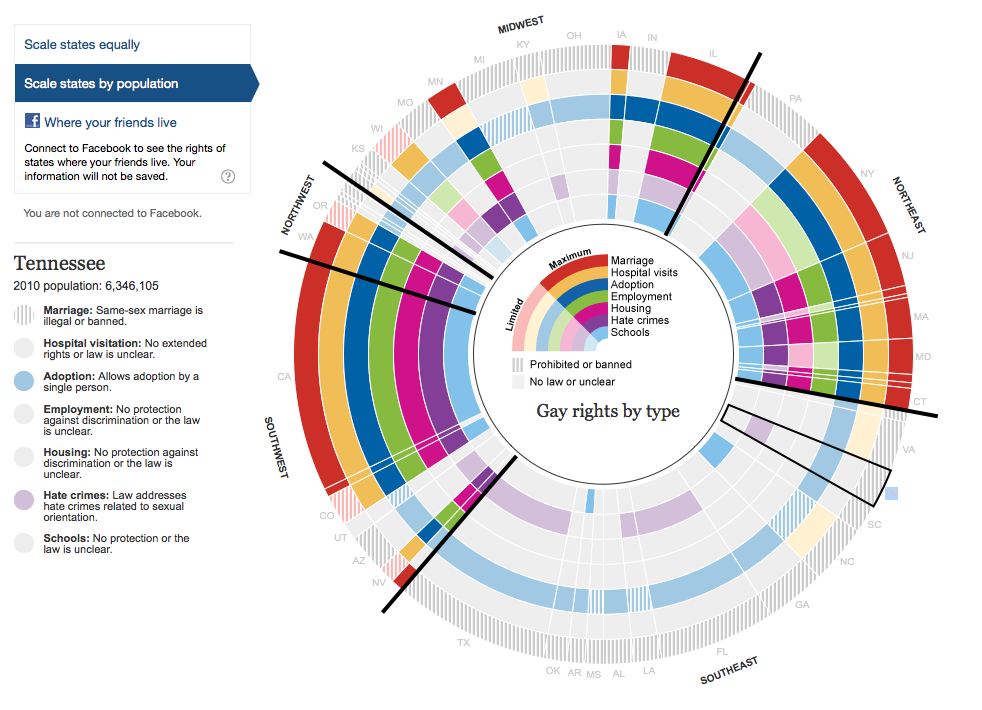
This is a relatively simple set of data: take fifty states, sort them by geographic location, add some population data, mark seven fields using one of four flags (allowed, limited, prohibited, or unclear), garnish with social media links and bake until done. What happens here is inflation by conflation – by building a vibrant visual composite out of a series of dry data points, the end user is given the tools by which he or she can gain a greater understanding of each division (by state, by region, by population, or by type of right) without needing to go to great calculatory lengths.
Great choices. All of these are created by organizations on the leading edge of data journalism. Excited to see how they might inspire your final project.