The other day during class I scraped data the Congressional Medal of Honor Society’s website using Outwit Hub. Ahead of today’s assignment, I figured I would pull together a guide on how I did it.
Step 1. We need to decide what we want and where it is.
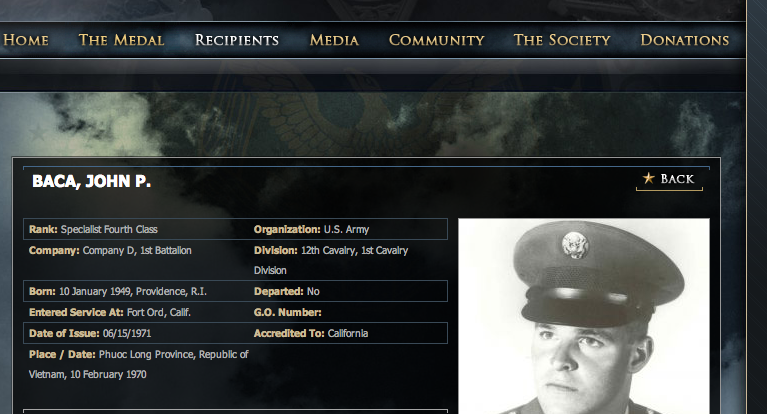
I want some descriptive data about living medal of honor recipients in order to provide some context to the reporting we are doing at the Medal of Honor Project. Specifically, I want the recipients’ name, rank, date of birth, date of medal-winning action, place of action, MoH issue date, place of birth and place of action.
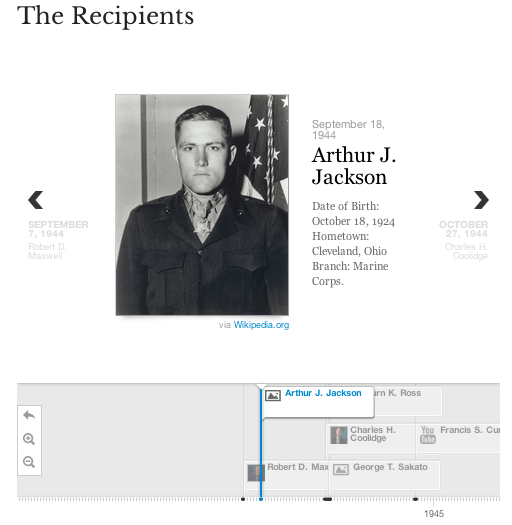
If I choose “Living Recipients” from the “Recipients” tab, I see this:

If this screen had all the information I needed, I could easily use the Chrome Scraper extensions to grab the data. Unfortunately, I want more information than their name, rank, organization, and conflict. If I click on one of the entries, I can see that all the information that I want is on each entry page.
So now we know that we want to grab a handful of data from each of the pages of the living recipients.
Step 2. Collect the addresses of all the pages we want our scraper to go to (i.e., the pages of all the living recipients).
We can do this in a number of ways. Since there are only 75 living recipients, across three pages, we could easily use the Chrome Scraper Extension to grab the addresses (see this guide if you forget how to use it).
Since I am using this project as practice for grabbing data from the pages of all 3,463 recipients, I decided to write a scraper in Outwit to grab the addresses.
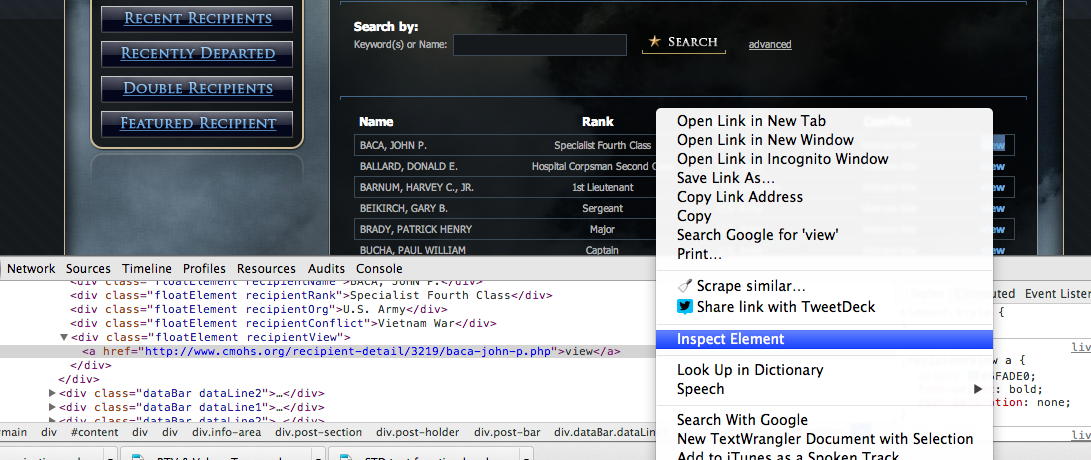
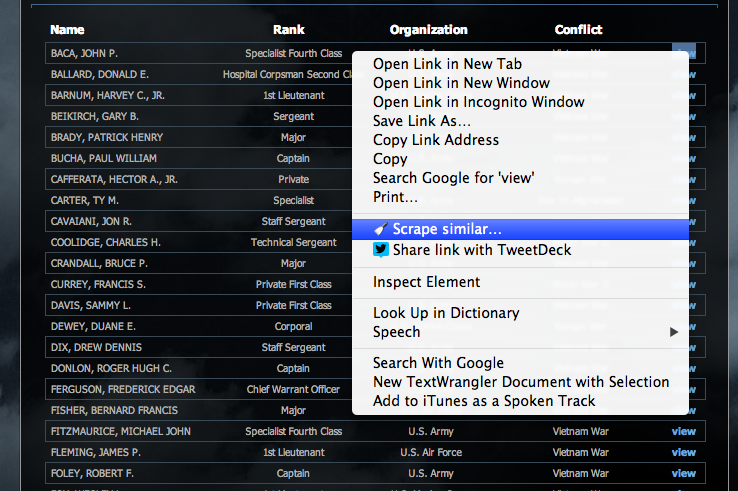
To write a scraper, I need to tell the program exactly what information I want to grab. I start this process by looking at the coding around the items I want using the “Inspect Element” function in Google Chrome.
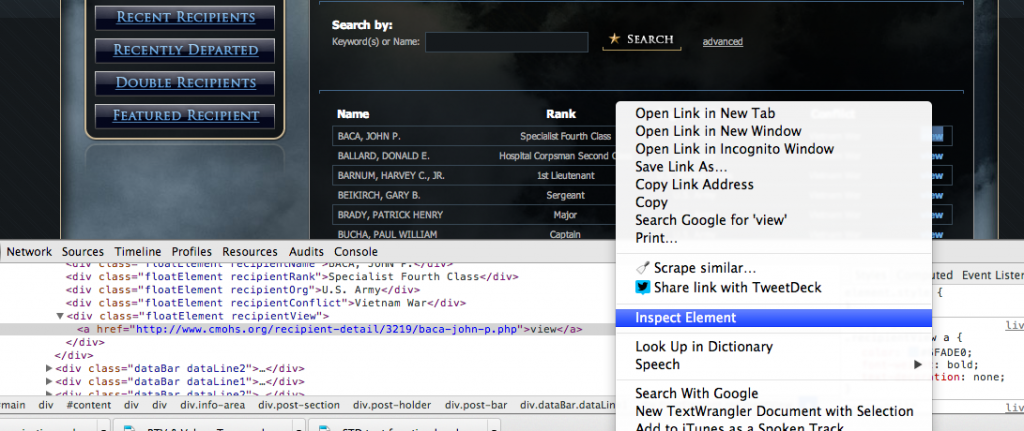
If I right-mouse click on the “view” link and click “Inspect Element,” I will see that this is the line of code that relates to the link:
<div class="floatElement recipientView"><a href="http://www.cmohs.org/recipient-detail/3219/baca-john-p.php">view</a></div>
This line of code is all stuff we have seen before. This just a <div> tag with an <a> tag inside it. The <div> is used to apply a class (i.e., floatElement recipientView) and the <a> inserts the link. The class is unique to the links we want to grab, so we can use that in our scraping. We just need to tell Outwit Hub to grab the link found within any <div> tag of the recipientView class.
In Outwit, we start by loading the page we want to scrape.
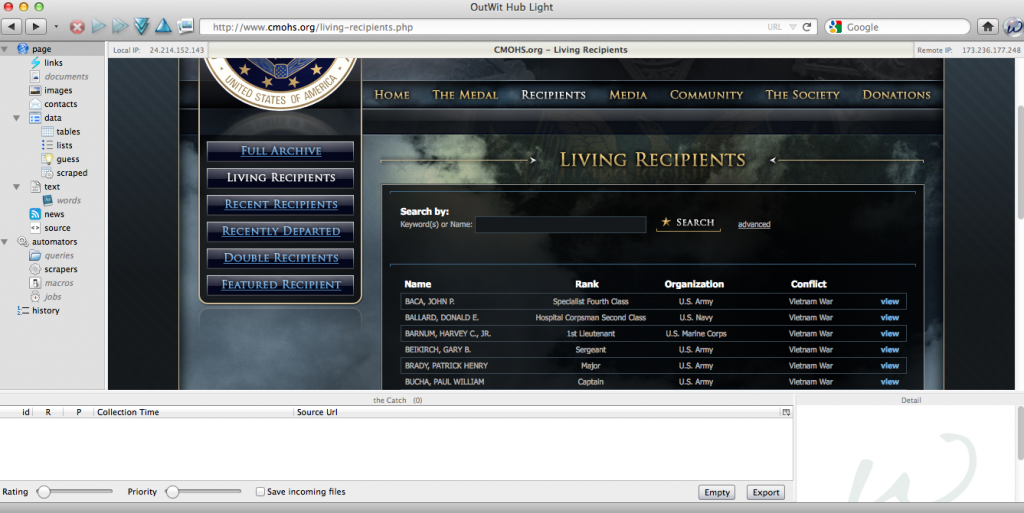
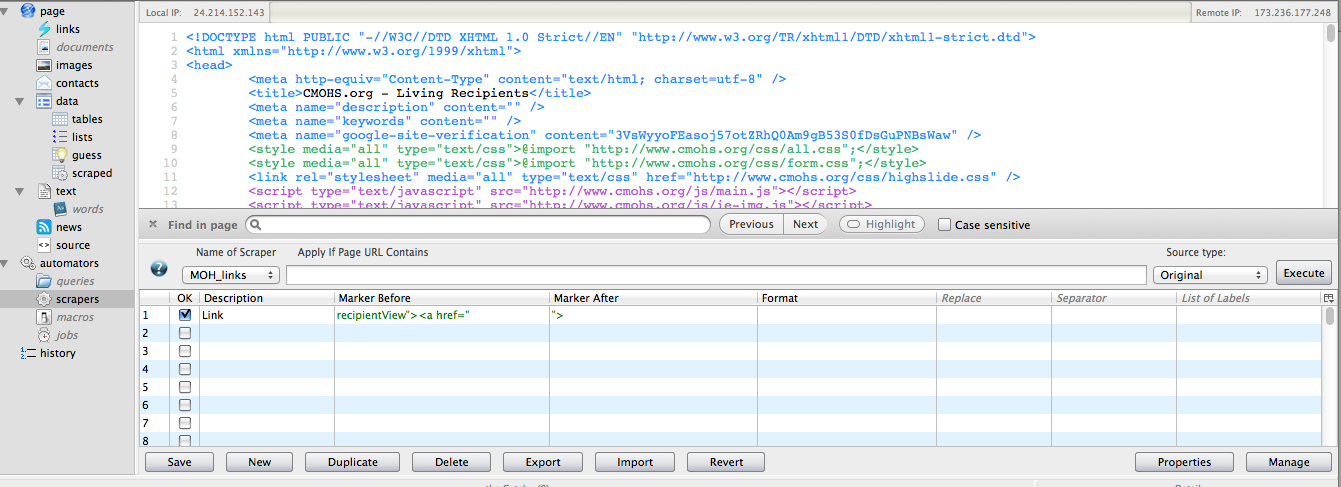
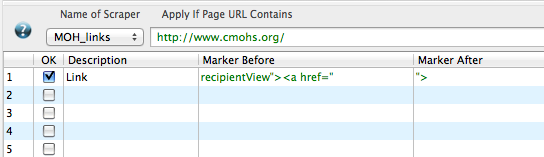
Then we want to start building our scraper by choosing “Scrapers.” When we click into the scraper window, we will have to pick a name for our scraper. I chose “MoH Links.” You will also see that the CMOHS website has flipped in to a code view. We will enter the directions for our scraper in the lower half of the screen, where it says description, marker before and marker after.
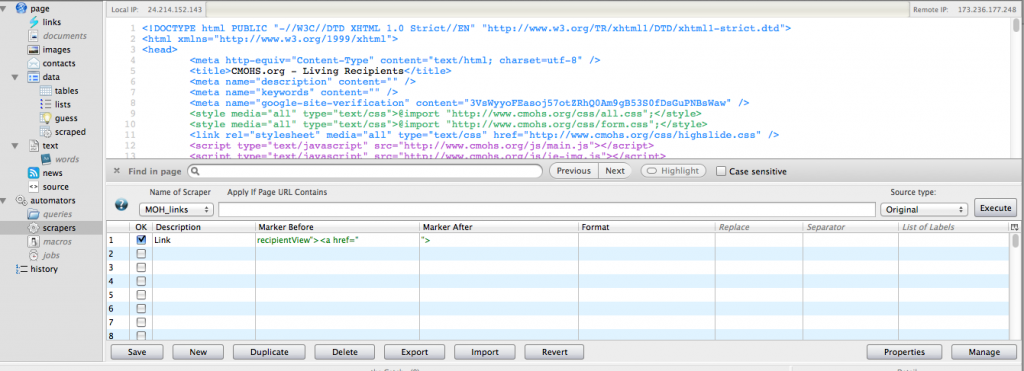
We just need one bit of info, so our scraper in simple. I entered:
- Description = Link
- Marker before = recipientView”><a href=”
- Marker after = “>
You can then hit “Execute” and your scraper should grab the 25 addresses from the first page of living recipients. But remember, I don’t want the addresses from just the first page, but from all three pages.
To do this, I need to step back, get super meta, and create a list to make a list. If you go to the second page, it is easy to see how these pages are organized or named. Here is the address for the second page of recipients:
http://www.cmohs.org/living-recipients.php?p=2..
Not shockingly “p=2″ in english is “page equals two.” A list of all the address is simple to derive.
http://www.cmohs.org/living-recipients.php?p=1..

http://www.cmohs.org/living-recipients.php?p=2..


http://www.cmohs.org/living-recipients.php?p=3..
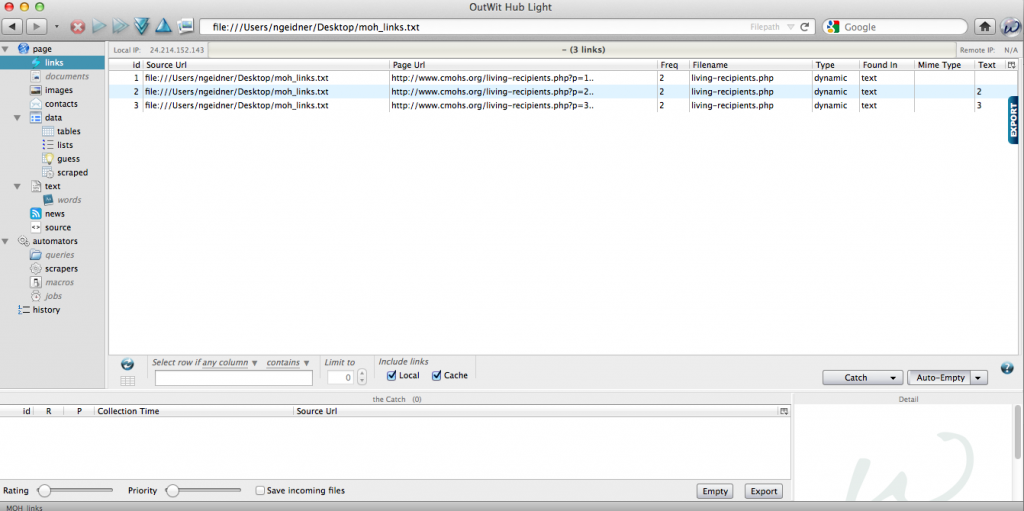
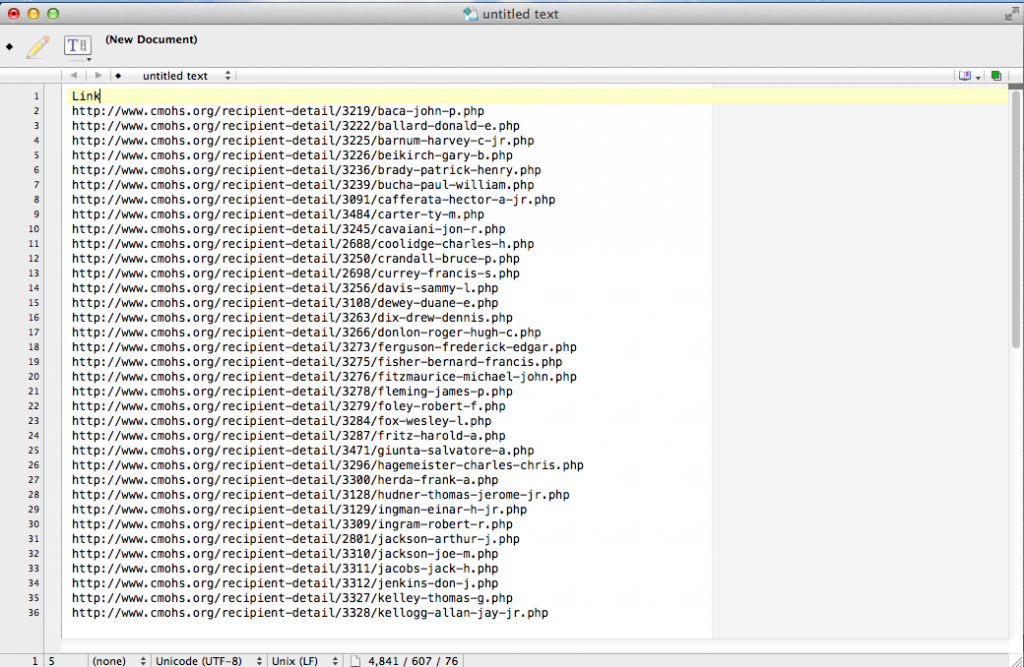
If you create this list as a simple text file (.txt), we can bring this into Outwit Hub and use our scrape on all of these pages. After I create the text file, I go to Outwit choose “File > Open” and select the text file. Next, select “Links” from the menu on the right-hand side of the screen. It should look like this:
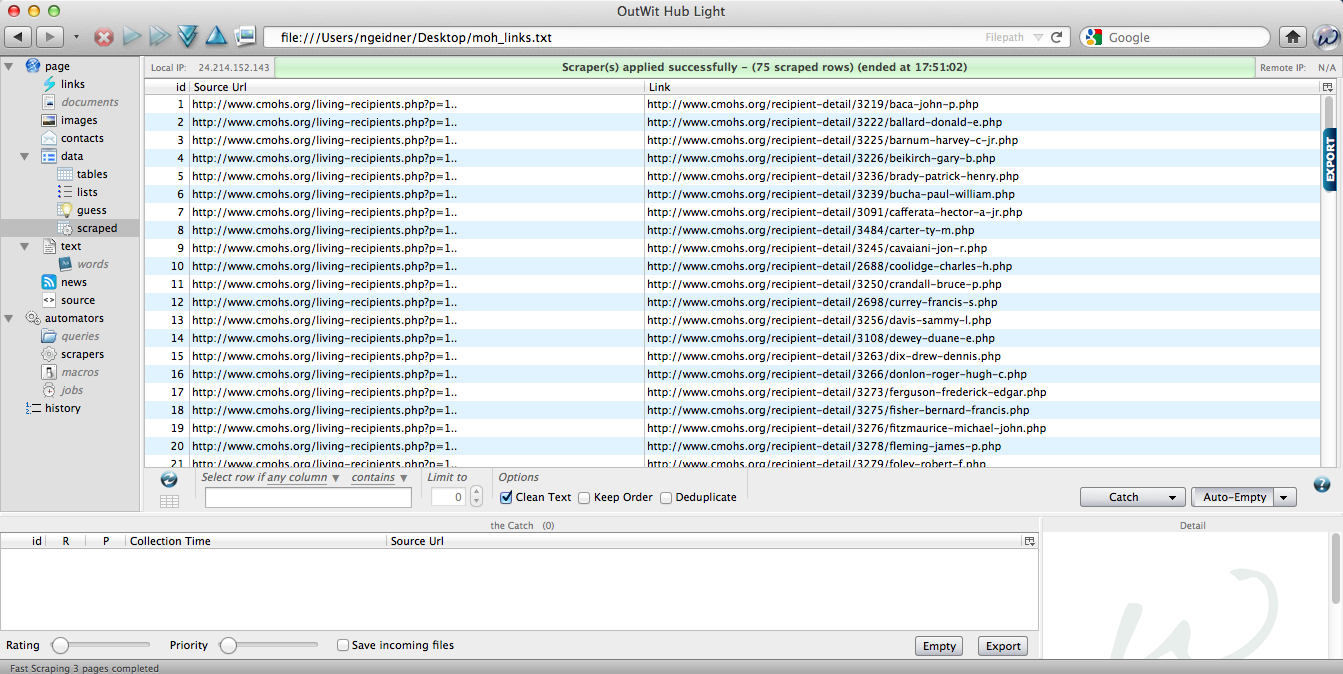
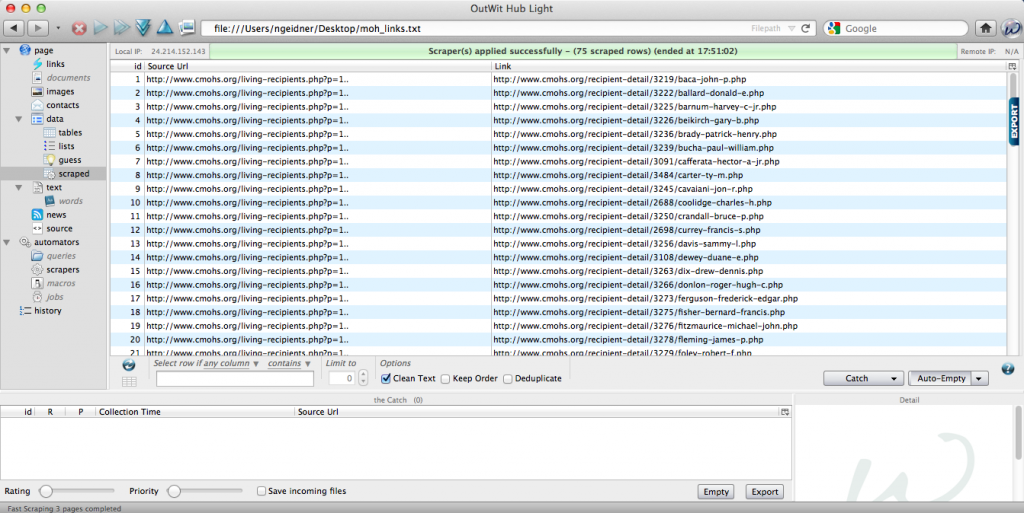
Now, select all the links by using Command+A. Then right-mouse click and choose “Auto-Explore Pages > Fast Scrape > MoH Links (or whatever you named your scraper).” OutWit should pop out a table that looks should of like this:
YOU JUST RAN YOUR FIRST SCRAPER!!!
Way to go!
Now just export these links. You can either right-mouse click and select “Export selection” or click “Catch” and then hit “Export.” I usually export as a Excel file. We’ll eventually have to turn this file in to a text file, so we can bring it back into OutWit. For now, just export it and put it to the side.
Step 3. Create a scraper for the data we actually want.
We are going to start with “Element Inspector” again. Remember, we want to find unique identifiers related to each bit of information we want to grab. I went in an look at each piece of information (e.g., Issue Date) and looked at the coding around the information.
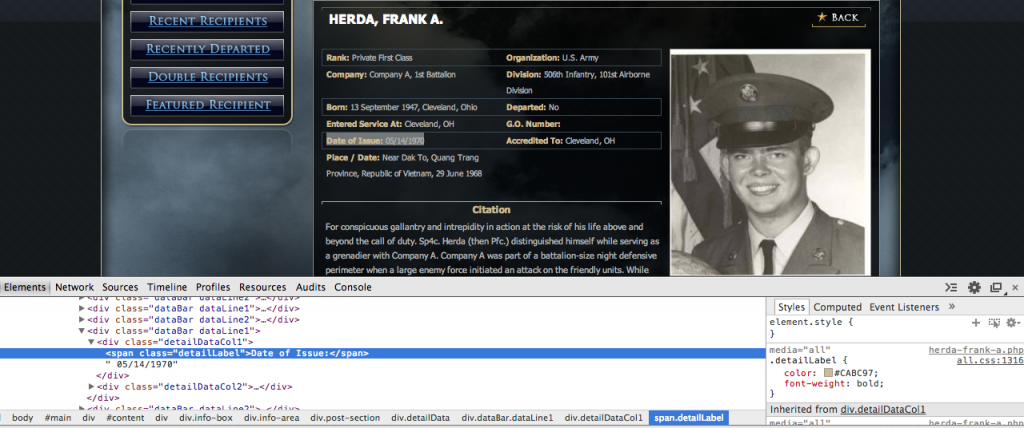
If you run through each of the bits of information we are grabbing, you start seeing a pattern in the way the information is coded and unique identifiers for each piece of information. For example, the code around the “Date of Issue” looks like this:
<div><span>Date of Issue:</span> 05/14/1970</div>
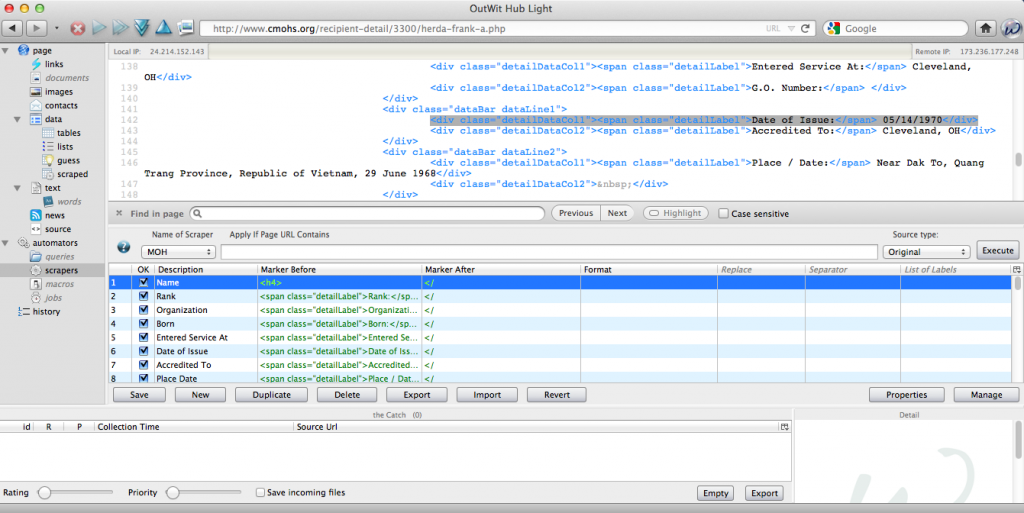
And it looks like that on every page I need to scrape. So I can enter the following information into a new OutWit scraper – I called this one MoH data – in order to grab the date:
- Description = IssueDate
- Marker before = Issue:</span>
- Marker after = </
OutWit will grab the date (i.e., 5/14/1970) which is all the information between the “>” after the span to the “</” which closes the span.
Just about every piece of information we want has a label associated, which makes it very easy to scrape. I just went through and created a line in OutWit for each piece of data I wanted, using the label as the marker before.
The only piece of information that doesn’t have a label is the name. If you right-mouse click on it and choose “Inspect Element,” you will see that it is surrounded by an <H4> tag. If you use the Find function (command+F), you’ll see that the name is the only item that has an <H4> tag associated with it. So we can tell OutWit to grab all information between an <H4> tag, like so:
- Description = Name
- Marker before = <H4>
- Marker after = </
Once I got my scraper done, I hit the “Execute” button to see if it worked. It did!
Step 4. Now I just need to tell OutWit where to use my new scraper.
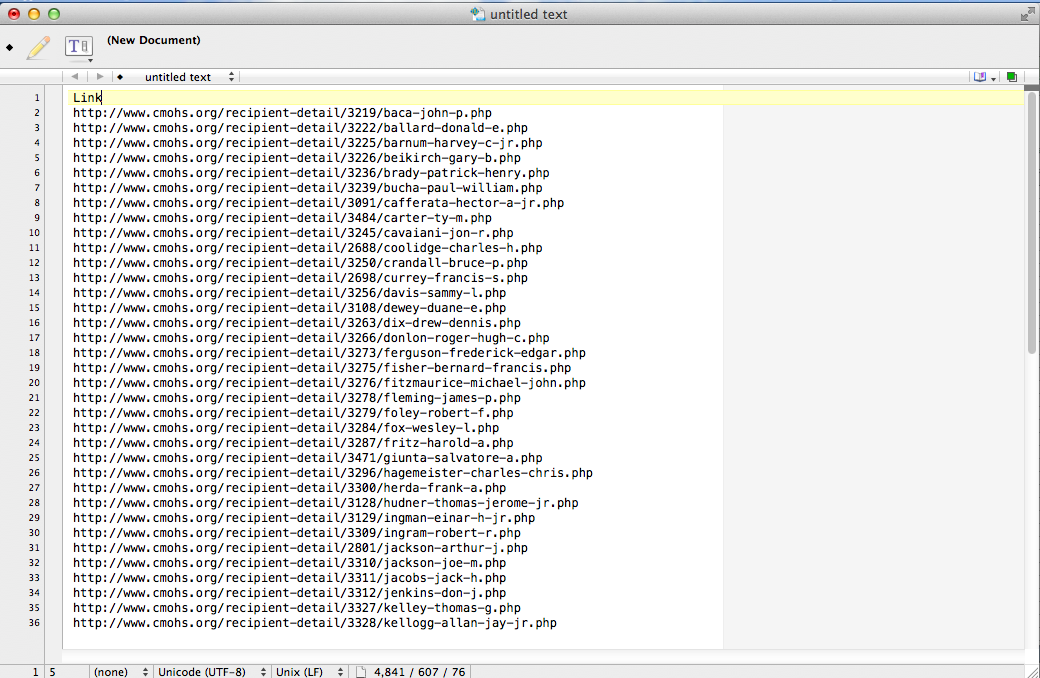
Go back to the Excel file you create in Step 2. Copy the column of links and paste them into a new text file. Save this new text file. I called mine mohlinks2.txt.
Next we open up OutWit. Before actually start scraping we need to deal with a limitation of the free version of OutWit. You can only have one scraper assigned to a given web address in the free version. So we need to change “MoH Links” (our first scraper), so it is not associated with cmohs.org.
Open up “MoH Links” on the “Scrapers” page of OutWit. Below where it says “Apply If Page URL Contains” there is a box the contains “http://www.cmohs.org.” Delete the address from that box and save the new “MoH Links” scraper. Now go into the “MoH Data” scraper and enter the cmohs address in the same box, save the scraper, and then close and reopen OutWit.
Next open the mohlinks2.txt. Select all the links (command+A) and choose “Auto-Explore Pages > Fast Scrape > MoH Data (or whatever you named your scraper).” Slowly but surely OutWit Hub should go to each of the 75 pages in our links text file and grab the bits of information we told it to grab. Mine worked perfect.
All that you need to do is export the data OutWit collected and then you can go into to Excel to start cleaning the data and pulling information from the data.
Although this first one probably seemed a bit rough, you will get used to how information is structured in websites and how OutWit works over time.