Hopefully, you came up with the idea of the pulling income data in to your map. As we all know the best source for income data is the U.S. Census Bureau. In past years, you would have to dig through the data provided by the Census, which is rough. Now-a-days it is a lot easier, because of Census Reporter.
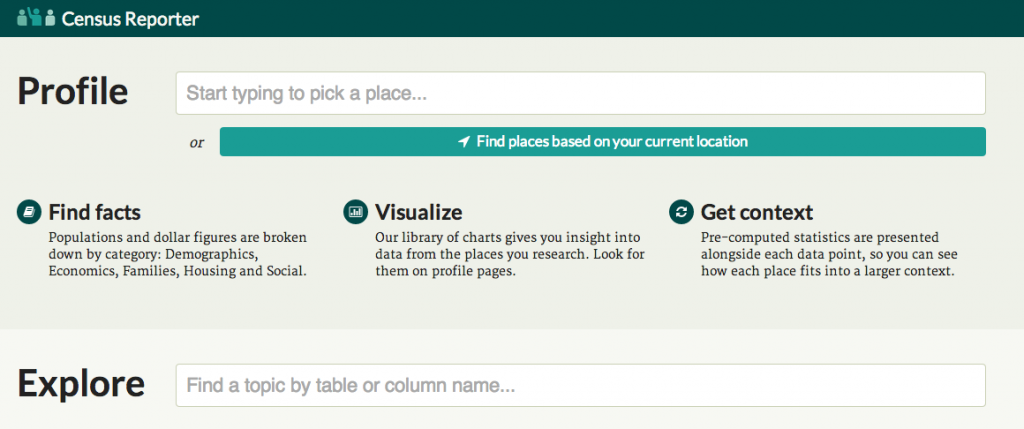
Census Reporter has made accessing Census data simple. Seriously, I mean SUPER simple. Really.
In a handful of clicks, we can get census tract-level household income data for Knox County. Even more badass, we can download it as a KML. Seriously…a KML file. Yay!
Oh wait, you don’t know what a KML file is? A KML file, or Keyhole Markup Language file, is a format used to display geographic data in Google Maps. We can use a KML file to draw boundaries on a map. In this case, we will draw the borders of the census tracts. Let’s go ahead an create a new Fusion Table with the data from Census Reporter.
Now we should have two Fusion Tables that each hold a part of our project:
- Census tract-level household income
- Location of meth-related incidents
There are multiple ways we can combine these, but as always we will use the easiest possible way. In this case, the tool of choice is the Fusion Tables Layer Wizard.
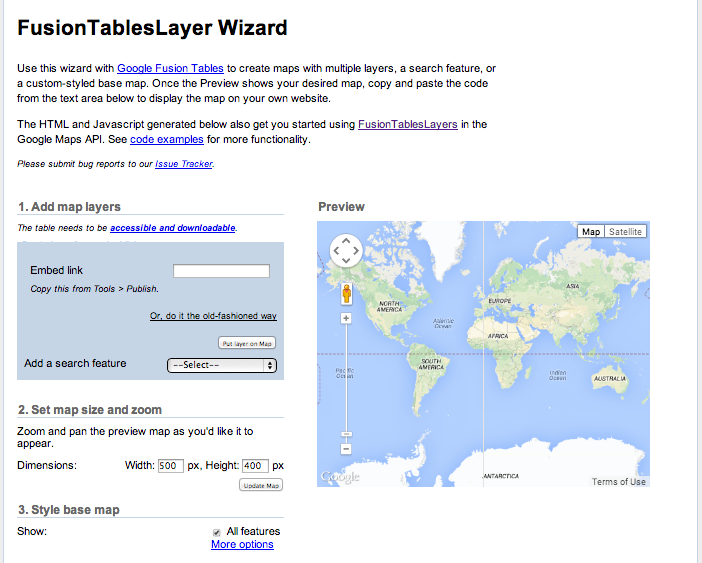
Some kind soul made an automated tool for accessing the Google Maps API. We just tell the wizard where to get the info, and it spits out the corresponding HTML code. AMAZING.