A dataset doesn’t just turn itself into a story. It takes a lot of forethought and organization to make a graphic or multimedia story. One of the most common ways to start organizing a story is to storyboard. Storyboarding involving quickly sketching out the ideal end product.
Through out the design process you will more than likely go through multiple rounds of storyboards. The first might be a very generic layout of the page, pulling together and defining the content you are going to want.
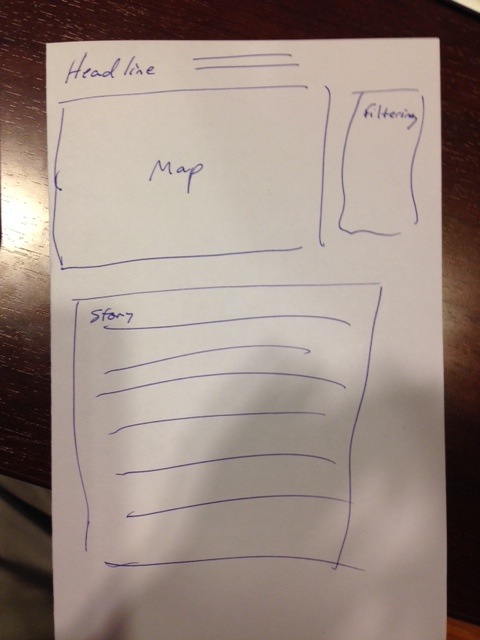 In this first storyboard, I defined what I wanted (a map, navigation, and a text area). I then went out to collect and started creating the content. After I collected the content and started looking at the data my story changed a bit and I created a new storyboard.


Again I have identified all my content and gave myself an idea of how everything should be put together. I can then move into building each element and pulling it together in the web presentation.
Today we will start thinking visually by creating a storyboard. We are working for the KnoxNews and they have asked us to create a graphic about the athletes in the Olympics (unfortunately we will be using data from the 2012 London Olympics). The information that we have is from the IOC media guide. Come up with ideas for graphics you would like to create and sketch them out on the notecard I provided.
You can find the data here.