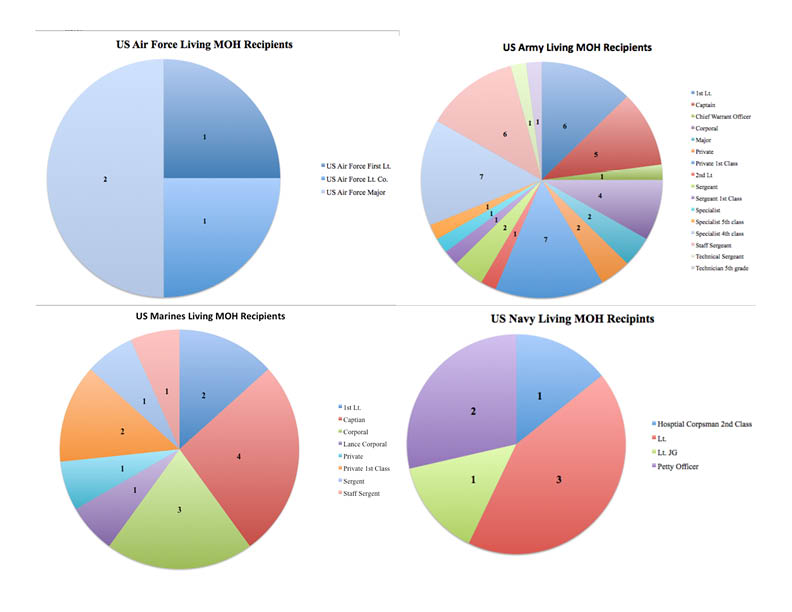
Deadline Graphic
Today, we will be looping back to charts. You have the next 45 minutes to create a graphic from the living Medal of Honor recipient data I collected a few weeks ago.
The data can be downloaded from here.
You can use Excel or Illustrator.
Here is a guide to using Illustrator.
Map Test 4/03
Stepping up our map (cont.)
Hopefully, you came up with the idea of the pulling income data in to your map. As we all know the best source for income data is the U.S. Census Bureau. In past years, you would have to dig through the data provided by the Census, which is rough. Now-a-days it is a lot easier, because of Census Reporter.
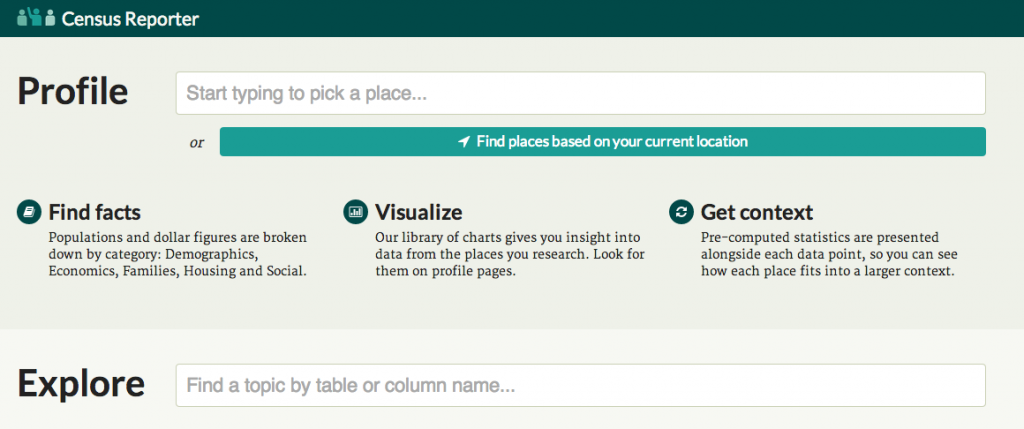
Census Reporter has made accessing Census data simple. Seriously, I mean SUPER simple. Really.
In a handful of clicks, we can get census tract-level household income data for Knox County. Even more badass, we can download it as a KML. Seriously…a KML file. Yay!
Oh wait, you don’t know what a KML file is? A KML file, or Keyhole Markup Language file, is a format used to display geographic data in Google Maps. We can use a KML file to draw boundaries on a map. In this case, we will draw the borders of the census tracts. Let’s go ahead an create a new Fusion Table with the data from Census Reporter.
Now we should have two Fusion Tables that each hold a part of our project:
- Census tract-level household income
- Location of meth-related incidents
There are multiple ways we can combine these, but as always we will use the easiest possible way. In this case, the tool of choice is the Fusion Tables Layer Wizard.
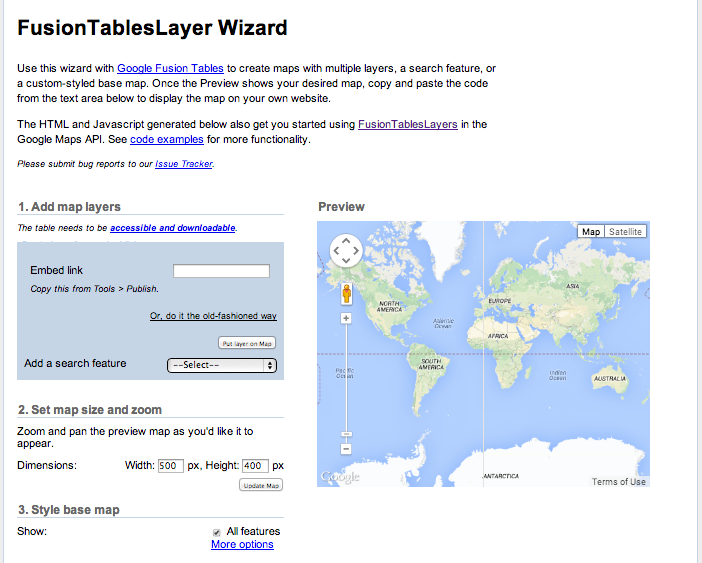
Some kind soul made an automated tool for accessing the Google Maps API. We just tell the wizard where to get the info, and it spits out the corresponding HTML code. AMAZING.
Today’s assignment: Stepping up our map
Our meth map the other day gave the reader some information (i.e., the locations of meth arrests and quarantines), which is cool. But we can do a lot more. I will go over a couple ways to expand on our first map.
First, we might want to make our map a little more user friendly. One way to do this would be to make it so the user can search of a specific address and find incidents near that location. This is probably not very useful in our use case – we know the city -, but for someone moving to Knoxville it could be very useful.
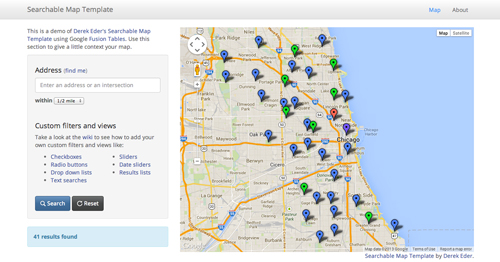
To do this we can use a open-source (read as free) JavaScript library created by Derek Eder. It is ridiculously simple. On that page, he shows you how to do it in seven steps. We won’t go through that, but know it exists and is easy.
Second, we can add more context to the map. For instance, one thing we might want to look at the relationship between poverty and methamphetamine incidences.
How could we go about doing this?
Meth Labs in East Tennessee — Gage and Dargan
Gabrielle and McKenzie’s Map
Meth labs in Knox
Map test 4/1/14
David Doyle and Sam Habib