Assignment 1 — Jan. 14 (Gage Arnold)

Explore the data: U.S. mass killings since 2006

USA Today

USA Today data journalism


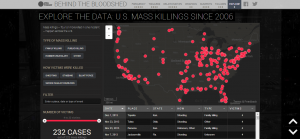
This is the definition of neat. USA Today grouped together the every mass killing — involving four or more being killed in one incident — and used the data to track trend locations, victim relations to the killer and how each victim was killed. Hearing a number like “232 mass killings since 2006″ doesn’t seem to  carry as much impact as a graphical display of just how these murders took place. I was blown away by this.

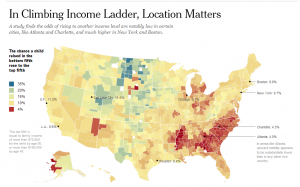
In climbing the income ladder, location matters

David Leonhardt/New York Times

NYT interactive data


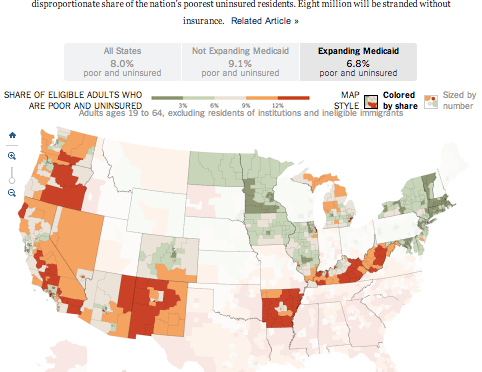
The New York Times published survey data in an interactive form that noted just how difficult it is to rise through income classes for residents in the Southeast. While a simple article noting the degree of difficulty is OK, the chart really breathes life into the data, helping us not only to understand the information put forth by the data but to make inferences on our own and to see the inequality for what it is instead of it being hidden among a bunch wordy text stories.

London Olympics 2012: How does each major team’s performance compare to Beijing 2008?

Garry Blight, Simon Rogers and Hilary Aked/The Guardian

guardian data


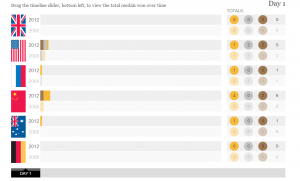
This is a relatively simple and clean bar chart from The Guardian but it illustrates context well. It’s hard to to a live-game comparison through text, but through a chart, our friends at The Guardian used the chart to track how the power countries were doing in the 2012 Olympics compared to the 2008 ones.

map

My inspiration and semester-long projects

I have been interested in multimedia journalism for my whole career, but I really got into data journalism and data visualization in the last few years. There were two projects that came out of the New York Times‘ data visualization lab around 2009-2010 that really inspired me to learn more about data journalism: the Budget Puzzle and Unemployment for People Like You.

Both projects give the reader a different view of a generic numbers stories (i.e., federal budget deficit and unemployment rate). They add context and nuance that traditional journalism (e.g., print or television) can’t give. They also allow the user to explore the information and come to his or her own understanding of the existing data. This type of self discovery can be a very powerful tool in teaching the reader about a complex topic, like variance in the unemployment rate.

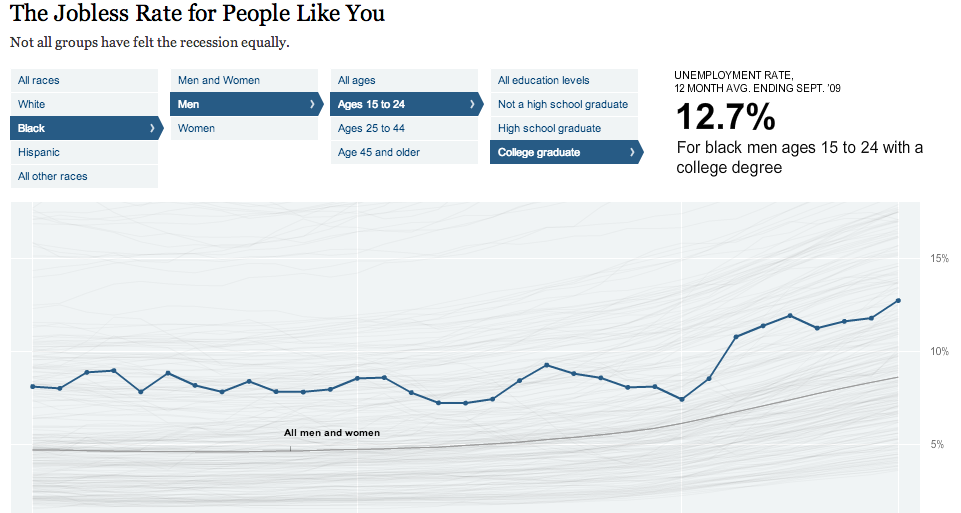
The jobless rate app (below) uses unemployment data from the Bureau of Labor Statistics (which is a great data source). In most news stories, the unemployment rate is treated like a single number across the population. The simple interactive graphic the New York Times created gets beyond the single number and lets the user see that the unemployment rate is not evenly distributed across the population.
Unemployment_people_like_me


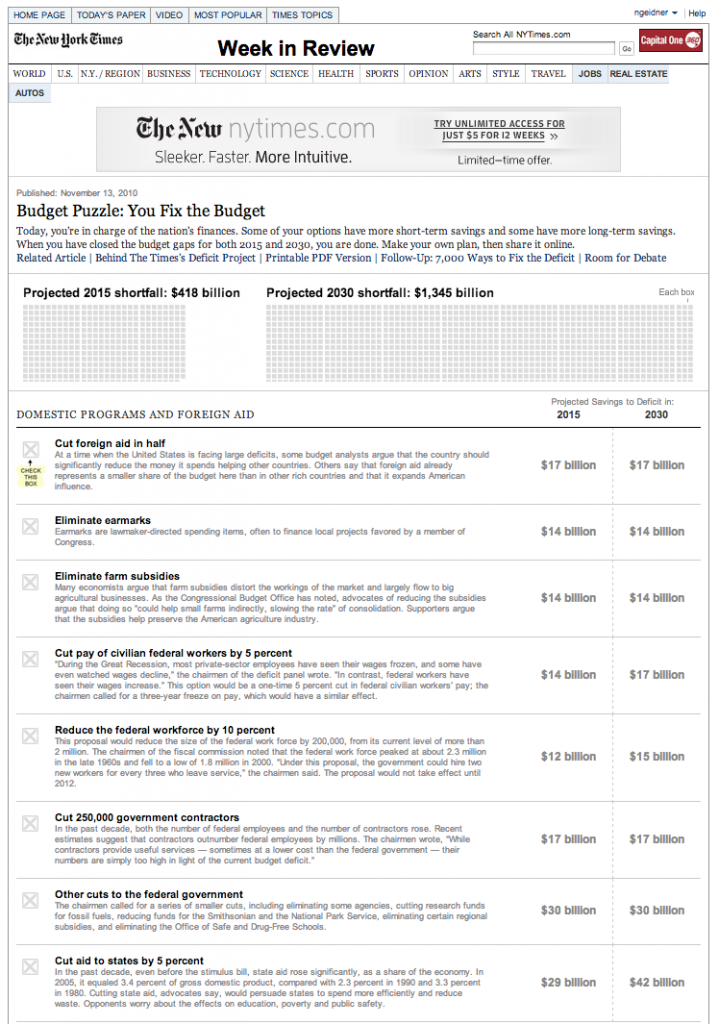
The Budget Puzzle is similar to the unemployment graphic in that it provides nuance to a number we hear all the time, but probably don’t understand. Unlike the unemployment graphic, the Budget Puzzle is framed to be a game. The user is charged with the task of balancing the budget.

The Budget Puzzle was widely popular. In its first week online, it received over one million page views and over 11,000 people posted messages on Twitter about the puzzle or their solution to the puzzle. In my opinion, this graphic, more than any other piece journalism, demonstrates the complexity and near impossibility of balancing the federal budget.
budgetpuzzle


These graphics made me interested in data journalism, but they are not the ones that are inspiring the projects I am going to work on this semester.

Current inspiration

My first project is inspired by two pieces of data journalism. First, the Knox News‘s weekly “Top 5, Bottom 5″ blurb. Every week, the Knox News publishes the scores of the top five and bottom five restaurant health inspection reports. My wife and I both love looking at it. I have no clue why, but we just love it.

The only problem is that I always say to myself, “Why only 10? I want to see them all!” So I have decided to map the most recent, routine health inspection for every restaurant, eatery and bar in Knoxville.

Although, the Knox News provided me with story inspiration, I still needed design inspiration. For that, I turned to the tried and true New York Times. I knew I wanted to do a map, so I started Googling around for “New York Times interactive maps.” After a while, I found the perfect inspiration.

map


You can see the draft for my project here. Through out the semester, we will learn how to do everything in this project.

My second project will be tied to the Medal of Honor Project. Specifically, I want to make a better website for people looking for information about Medal of Honor recipients. The current database run by the Congressional Medal of Honor Society has a lot of information, but is not the most exciting or user friendly.

Again, I knew what I wanted to do, but I couldn’t picture how to organize everything. I put the project on the back burner and figured I would eventually come up with an idea. That plan worked. I stumbled across an amazing project from the Austin Statesman.

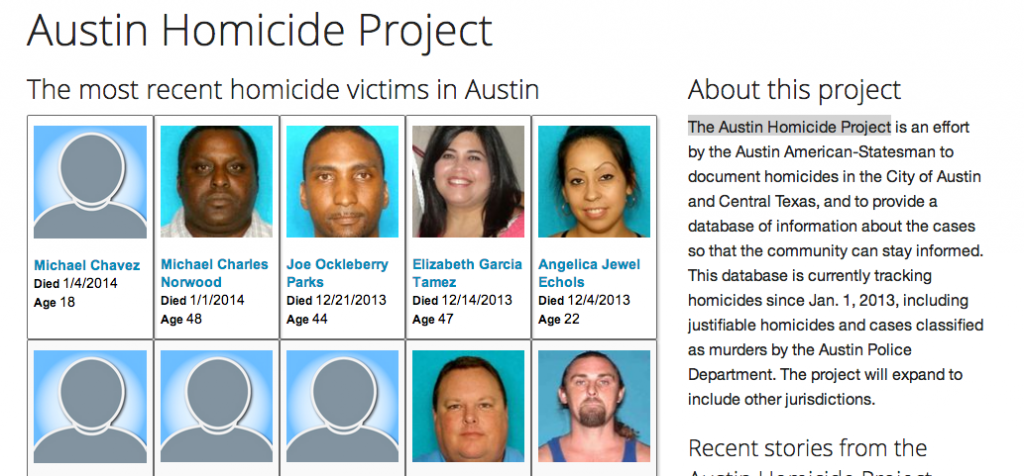
The Austin Homicide Project is similar to Homicide Watch D.C.  and aims to document every homicide in Austin, Texas. Their website includes a lot of information about a lot of people and displays in numerous ways (e.g., searchable databases, charts, and maps), just like I need for the Medal of Honor Project. Make sure to check out this site. It is very impressive journalism. 
homicide

I haven’t started working on this project yet, but I think the Austin Homicide Project will give me the design and organizational inspiration to get started. As I work on it, I will include updates on the blog and discuss it in class. We will also use some of the data in class for examples.
 

Assignment 1- Jan. 14

usa today-where the jobs are

Where the jobs are (USA Today)

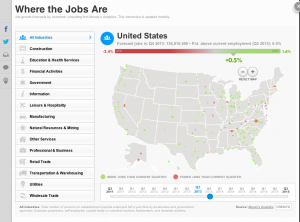
This interactive is updated monthly with job growth forecasts by economic consulting firm Moody’s Analytics. The map allows you to filter job data by industry, and view job growth forecast from 2011-2015.  You can also zoom in to view job forecasts in select cities.


nyt-election 2012

The Electoral Map: Building a Path to Victory  (New York Times)

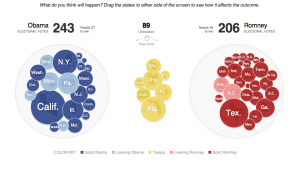
This map is from the 2012 presidential election. It takes you though a series of maps that shows the different ways Romney or Obama could take the White House. At the end, the user can play with the dots and create their own scenarios. Clicking on each dot tells you the number of electoral votes each state has, and the dots are color-coded as to which political party the state typically leans to.


Screen Shot 2014-01-13 at 8.41.51 PM


Sticker shock hits health exchange shoppers (USA Today)

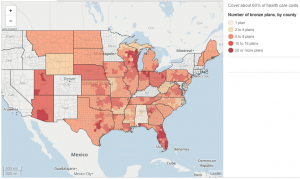
The story discusses the sticker shock some middle class Americans who aren’t eligible for  substitutes under the Affordable Care Act. The map allows the user to roll over each county in the 50 states and tells the number of bronze plans (plans that cover 60 percent of health care costs) in each county along with other demographic information about the county.


494 Assignment 1

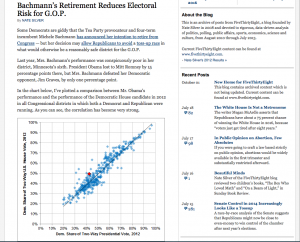
Bachmann’s Retirement Reduces Electoral Risk for G.O.P.
Nate Silver, FiveThirtyEight

Screen Shot 2014-01-13 at 8.13.06 PM

FiveThirtyEight is kind of easy mode for this kind of thing, but it’s nonetheless worthwhile to look at some of the less obvious things they do over there.  Here, Silver uses a dataset to provide insight into a political matter that was heretofore the sole domain of the gut reaction.  Losing a controversial representative like Bachmann just has to be good for the Democratic party, right?  Well, not so much, if the data has anything to say about it.

A Tangled Web: Who’s Making Money From All This Campaign Spending?
ProPublica

Screen Shot 2014-01-13 at 8.09.59 PM

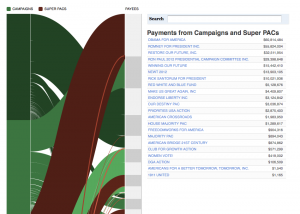
Here, ProPublica highlights the real winners of the 2012 presidential election – the 200 biggest recipients of campaign spending, each with their own tidy little summary and spaghetti-like series of links back to their respective political benefactors.  Sifting through this visualization for any length of time shows the user that even the most complex sets of data can be distilled to the point where their intrinsic complexities fall away, leaving the user free to understand and react to the underlying points.

Gay rights in the US, state by state
US interactive team, the Guardian

Screen Shot 2014-01-13 at 8.09.07 PM

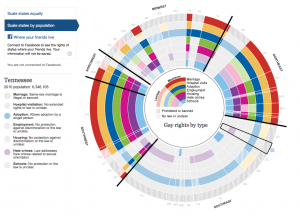
This is a relatively simple set of data:  take fifty states, sort them by geographic location, add some population data, mark seven fields using one of four flags (allowed, limited, prohibited, or unclear), garnish with social media links and bake until done.  What happens here is inflation by conflation – by building a vibrant visual composite out of a series of dry data points, the end user is given the tools by which he or she can gain a greater understanding of each division (by state, by region, by population, or by type of right) without needing to go to great calculatory lengths.

LookBookOutlet x nickgeidner Beige Colored Dress

LookBookOutlet x nickgeidner Beige Colored Dress / Crepe fabric/ Funnel Neckline

This nickgeidner x lookbookoutlet piece is a lovely maxi dress that has been made for petite ladies. It has a great keyhole feature and it has been made out of crêpe fabric that has a lovely pleating feature at the top of it. The dresses fit Is very true to the size and the piece is hand wash only. The material is a blend of polyester and elastane. In the picture the model is wearing a UK sized 8 dress, but you can get this up to a size 16. It is a great dress for anyone to wear, and you will look and feel like a queen when heading out to any occasion in this number. Beige dresses are simply a must have buy and will sit in your closet on the ready to be worn all year. Petitie items like this are hard to come by so you will feel great when heading out in this.